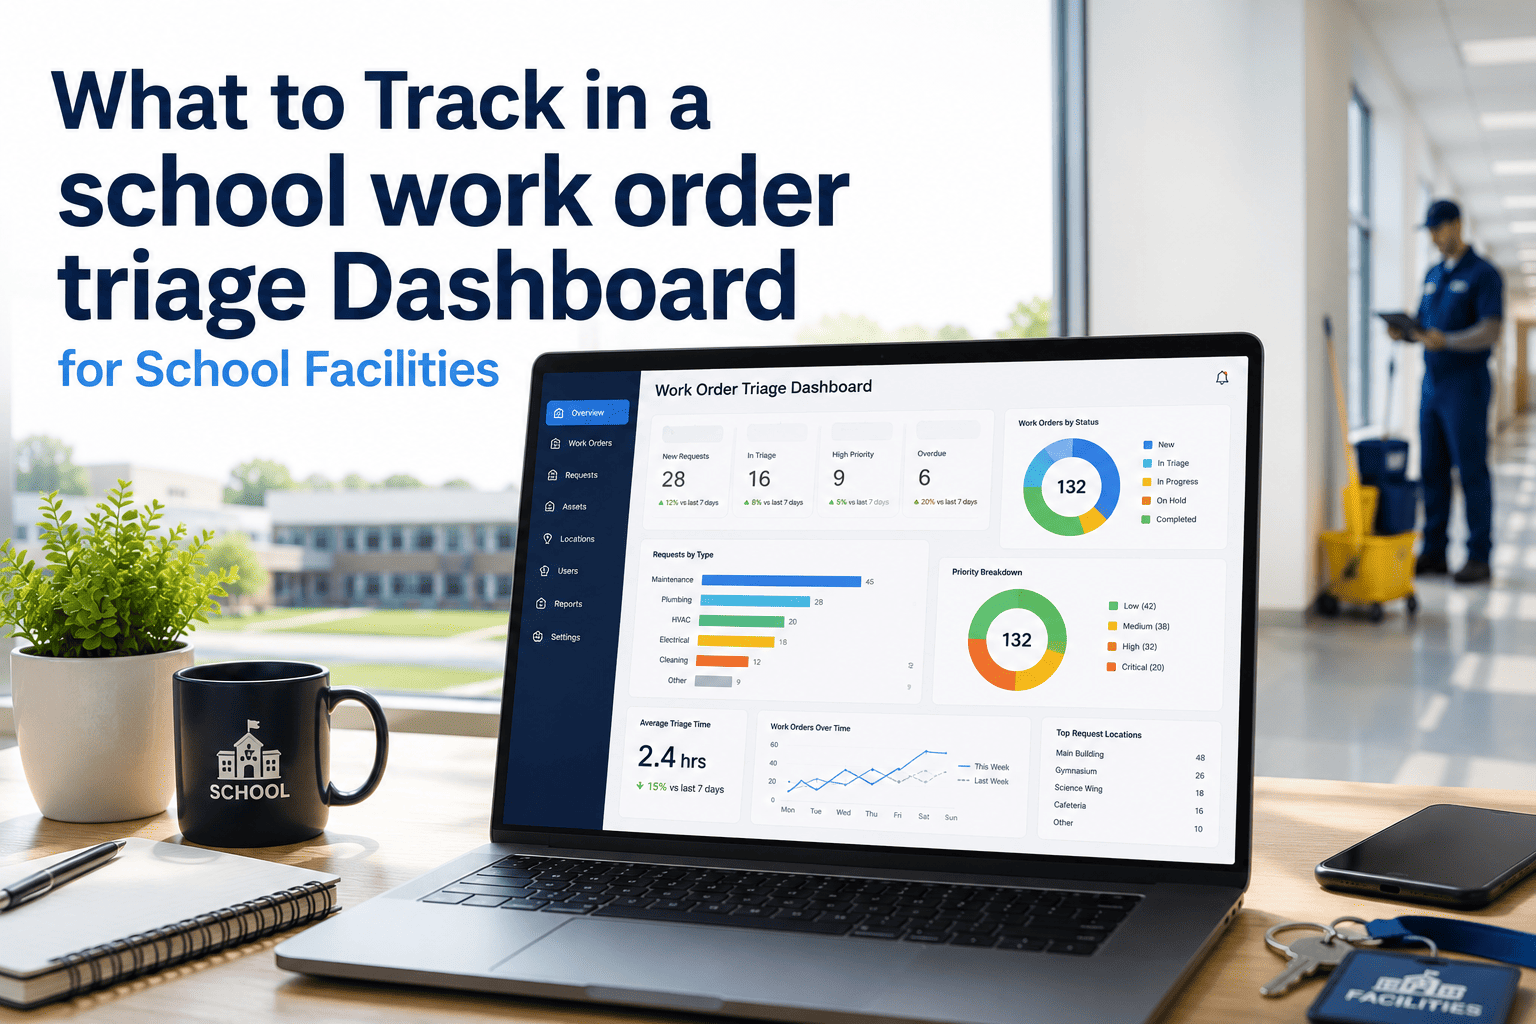
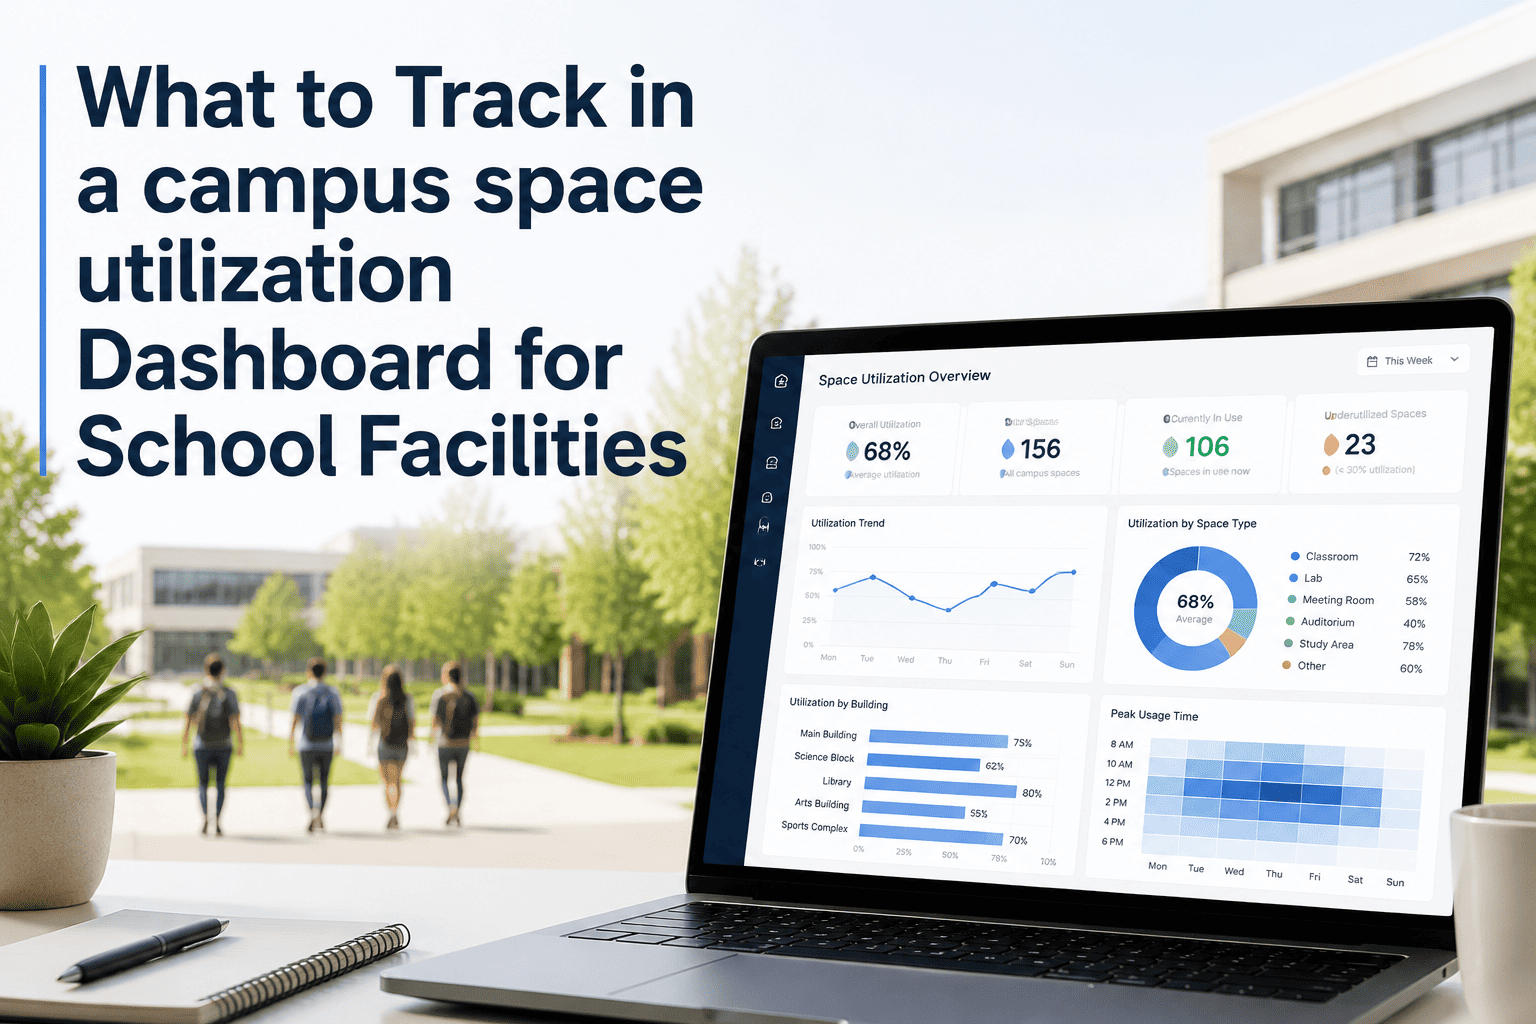
Every school facility manager knows the panic of a power outage during finals week or a storm that knocks out lights mid-event. A campus generator testing dashboard changes that by turning reactive scrambling into proactive control. When your team can see fuel levels, runtime hours, load capacity, and last-test dates at a glance, preparedness stops being a guess. OxMaint gives school districts and higher education teams a mobile-first CMMS with built-in analytics and reporting so every generator on every campus stays audit-ready, year-round. Start your free trial or book a demo to see the dashboard in action.
What to Track in a Campus Generator Testing Dashboard for School Facilities
School facilities directors and campus engineers rely on real-time generator data to keep students safe and buildings operational. Here is every metric that belongs on your dashboard — and why missing even one creates risk.
The Hidden Risk in School Generator Programs
Most school districts test their generators — but few track what those tests actually reveal. Paper logs sit in binders. Spreadsheets live on one person's desktop. When a state inspector arrives or a real emergency hits, the data is either missing, outdated, or impossible to export quickly. A centralized dashboard fixes this by making every test result, every maintenance action, and every fuel reading visible to the right people at the right time.
The 8 Metrics Every Campus Generator Dashboard Must Track
These are the data points that separate a useful dashboard from a glorified spreadsheet. Each metric has a direct line to either safety, compliance, or cost.
Ready to See Your Generator Data in One Place?
OxMaint gives school districts a mobile-first dashboard that tracks every metric above, auto-schedules tests, and exports compliance reports in under 5 minutes. No more binder hunts during inspections.
How OxMaint Builds Your Generator Dashboard
Paper Logs vs OxMaint Generator Dashboard
| Tracking Activity | Paper / Spreadsheet | OxMaint Dashboard |
|---|---|---|
| Test result retrieval for inspector | 1-3 days searching binders | Under 5 minutes, PDF export |
| Fuel level trend visibility | Not available | Graphed per asset, per term |
| Battery voltage trend alerts | Not available | Auto-alert on downward trend |
| Multi-campus compliance view | Not available | Single portfolio dashboard |
| Missed test detection | Manual calendar check | Auto-escalation to supervisor |
| Photo evidence per inspection | Not available | Attached with GPS and timestamp |
Frequently Asked Questions
What NFPA standards apply to school generator testing?
NFPA 110 governs emergency and standby power systems, requiring monthly exercise tests and annual full-load bank tests. OxMaint ships with pre-built inspection templates aligned to NFPA 110 so your team never misses an interval. Start a free trial to explore the template library.
Can OxMaint track generators across multiple school campuses in one view?
Yes. OxMaint uses a district-level portfolio hierarchy so a facilities director sees every generator across every campus in one dashboard. Each campus facilities manager sees only their own assets. Compliance scores roll up automatically to the district level.
How does OxMaint handle corrective actions found during a generator test?
Failed inspection items automatically generate a work order with an assignee, priority level, and due date. The dashboard shows open versus closed corrective actions per asset, so nothing is forgotten between inspection and repair. Book a demo to see the workflow.
How long does it take to set up OxMaint for a school district?
Most school districts are fully live within 3 to 4 weeks: one week for asset import, one to two weeks for PM template setup, and one week for mobile training. Implementation is included with no heavy upfront fees.
Can technicians complete generator inspections on a mobile device?
Yes. OxMaint's mobile app works on iOS and Android, online and offline. Technicians capture photos, fill in inspection fields, and sign off digitally — all data syncs to the central dashboard the moment connectivity is restored.
Give Your District a Generator Dashboard That Works When It Matters Most
Track fuel levels, test results, battery trends, and compliance scores across every campus — all in one place. OxMaint's analytics and reporting tools are built for school facilities teams who need to be ready before the next storm, not scrambling during it.