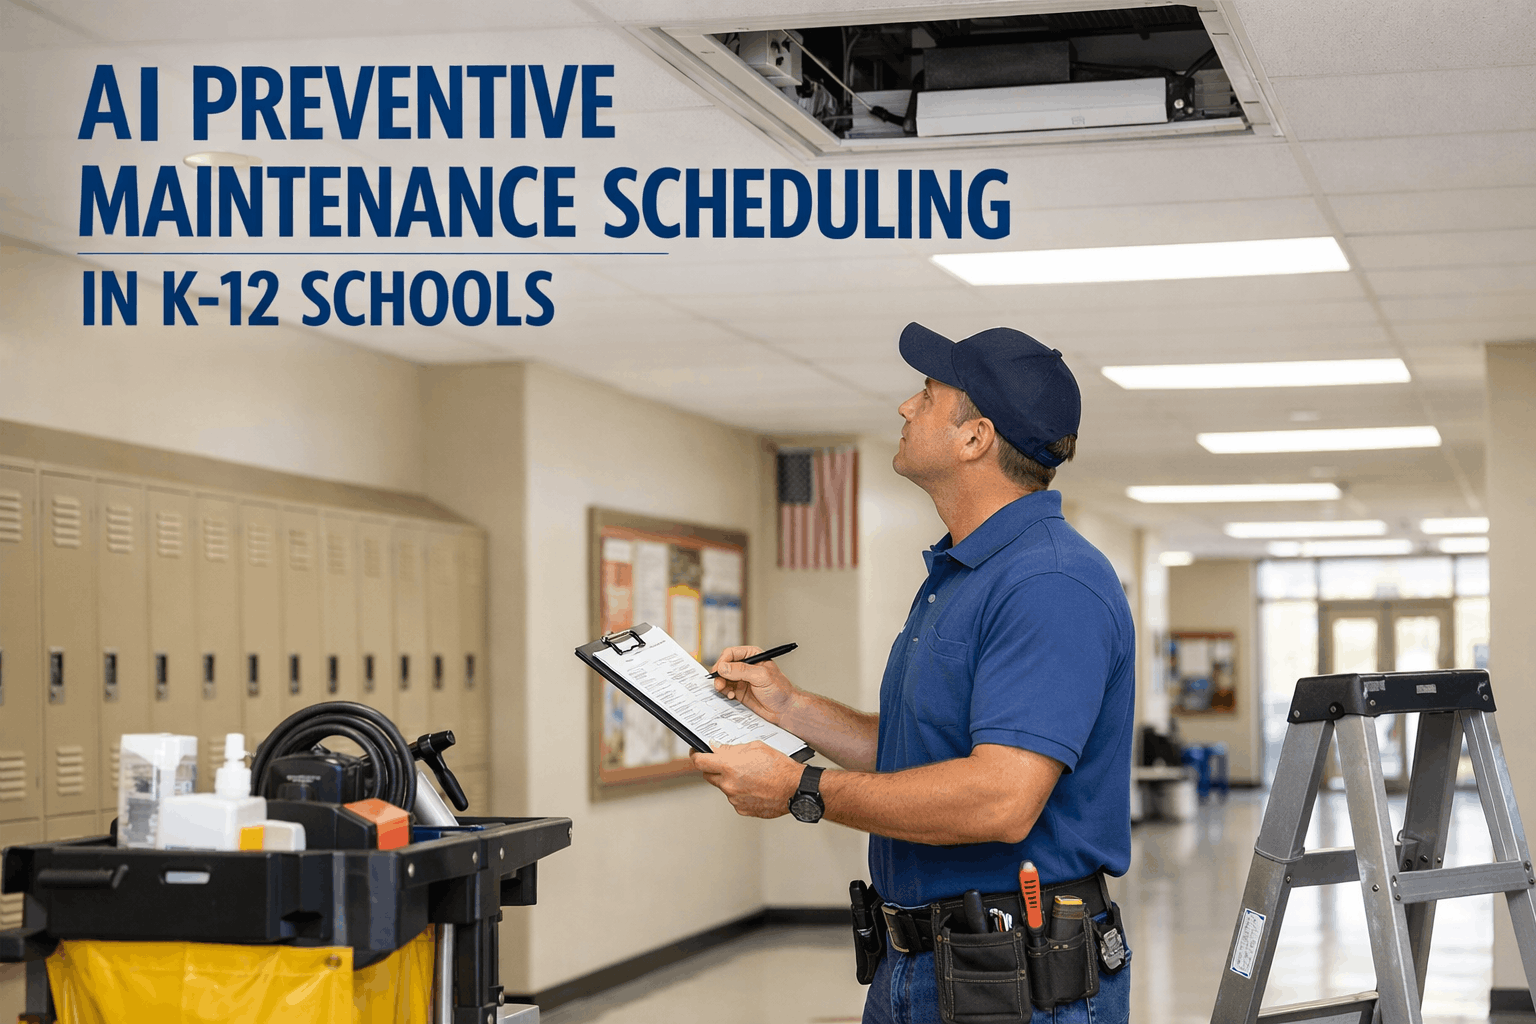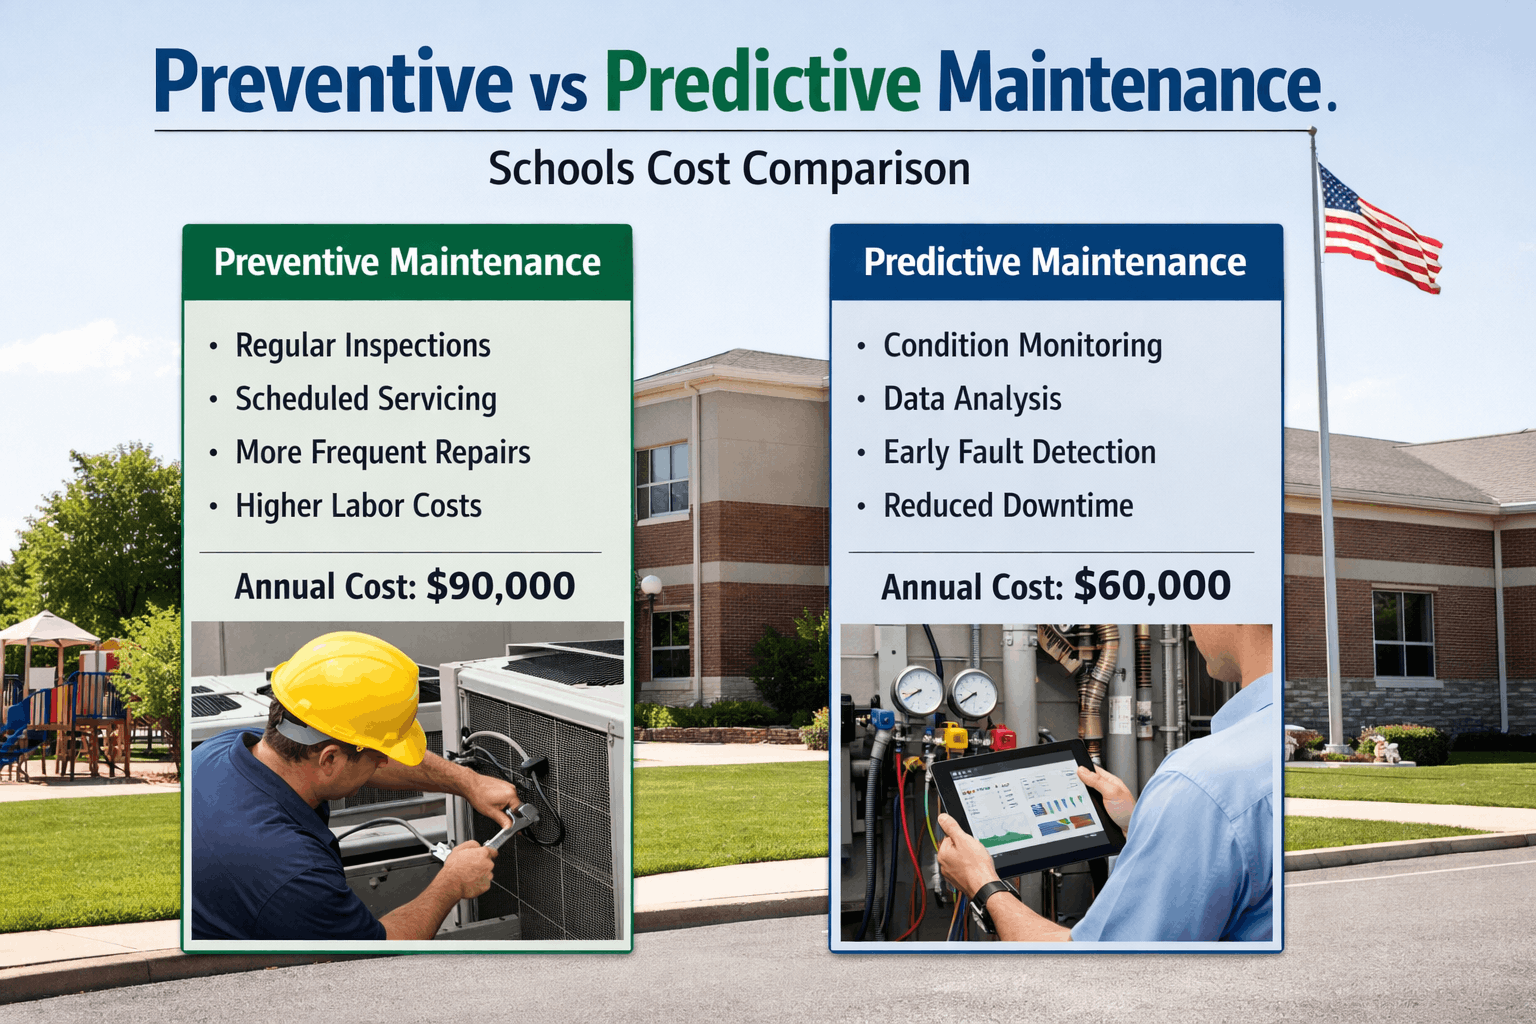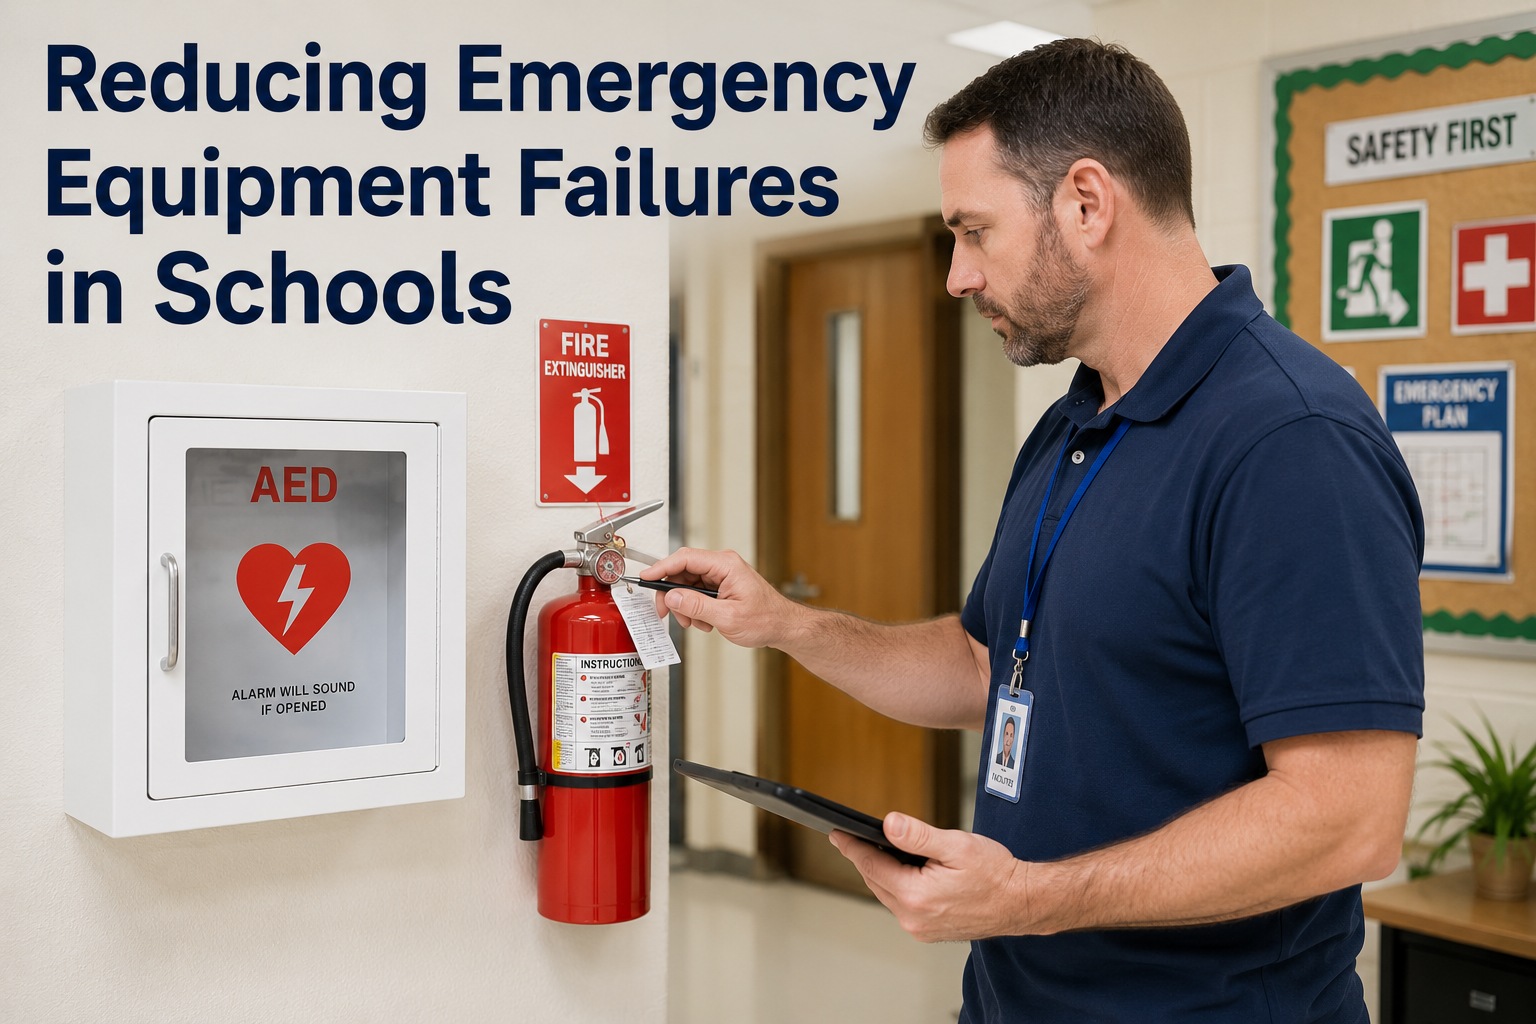
When a boiler trips at 7:40 a.m. on a January Monday, the cost is measured in more than the repair invoice — it is measured in cancelled classes, redirected buses, parent phone calls, and the overtime of a maintenance team forced into firefighting mode. Emergency equipment failures in schools typically cost three to five times more than the same repair scheduled through a preventive maintenance window, and they erode trust in facility leadership faster than almost any other operational breakdown. The good news is that a structured reliability program can move a district from 60 percent reactive maintenance to under 25 percent within eighteen months, freeing budget for upgrades instead of panic repairs. This guide breaks down the proactive school maintenance practices, condition-monitoring routines, and critical-asset strategies that make that shift durable. Ready to put it into practice? Start Free Trial and configure your asset register the same day.
Is your district spending more on panic repairs than planned maintenance?
A single emergency boiler, chiller, or elevator failure can cost 3–5× a scheduled fix, cancel classes, and trigger a wave of parent complaints. Shifting from 60% reactive to under 25% in 18 months starts with a deliberate reliability program — not a bigger repair budget.
What an emergency failure actually costs a school district
Industry benchmarking from APPA and ASBO International consistently shows that reactive maintenance carries a 3–5× cost premium over planned work, once overtime, expedited parts, and secondary disruption are loaded in. For a district running 60% reactive, that premium quietly consumes the capital budget.
A 12-building district spending $186K/yr on emergency calls
Consider a 4,200-student district with twelve buildings, 680 tracked assets, and an annual emergency repair spend of roughly $186,000. Audit of work orders revealed that 64% of that spend was concentrated in five asset classes: boilers, chillers, rooftop units, kitchen refrigeration, and elevators. By re-tiering those assets for preventive maintenance and adding quarterly condition checks, the district cut emergency calls 41% in year one and redirected an estimated $76,000 into a chiller replacement fund — money that had previously evaporated into overtime and expedited parts.
The five asset classes behind most school emergencies
Roughly 80% of emergency calls in K–12 facilities trace back to a small group of critical asset classes. Targeting preventive maintenance and condition monitoring at these five categories recovers the majority of reactive spend.
Boilers & hydronic heating
Failures peak October–January. Annual combustion analysis, relief-valve test, and low-water cutoff blowdown catch 70–80% of premature failures before the heating season starts.
Chillers & cooling towers
Refrigerant leak, condenser fouling, and flow switch faults dominate. Monthly log of approach temperature and quarterly water-treatment review keep summer-session failures off the principal's radar.
Rooftop units & air handlers
Belt, bearing, and coil failures account for most RTU emergencies. Filter changes on a 90-day cycle and quarterly vibration checks cut RTU emergency work orders by roughly a third.
Kitchen refrigeration
A single walk-in failure can destroy $4,000–$9,000 of food inventory. Door-gasket integrity, evaporator coil cleaning, and temperature logging reduce loss events by more than half.
Elevators & lifts
Most ADA-critical elevators sit on vendor contracts with Category 1 annual tests, but monthly in-house inspections of door operators and emergency lighting catch the entrapment-causing faults between visits.
A PM checklist that actually prevents emergencies
The difference between a checklist that prevents failures and one that just generates paperwork is specificity. Each task below is tied to a measurable failure mode — not a generic "inspect and report" line.
Heating season readiness (Aug–Sep)
- Combustion analysis on every boiler; record CO₂, O₂, stack temp
- Low-water cutoff blowdown and burner ignition test
- Hydronic expansion tank charge vs. system pressure
- Relief valve lift test and vent pipe integrity
Cooling season readiness (Mar–Apr)
- Chiller refrigerant charge and approach temperature log
- Condenser tube brush and cooling tower basin clean
- RTU belt tension, bearing play, and coil fin comb
- Cooling tower water treatment and legionella flush log
Year-round condition monitoring
- Monthly vibration spot-check on motors over 5 hp
- Weekly walk-in and reach-in temperature log review
- Monthly elevator door-operator and car-light inspection
- Quarterly infrared scan of electrical panels and bus
From 60% reactive to under 25% in 18 months
The shift from reactive to planned maintenance is governed by a simple but powerful ratio. Track it monthly, and the trend line tells you whether the program is working before the budget committee asks.
Goal: under 25% within 18 months. Best-in-class K–12 districts sustain 15–20%.
Premium = emergency invoice minus planned invoice for the same asset and failure mode.
Quarter-by-quarter reliability program rollout
Baseline & asset register
Audit work orders from the prior 12 months, tag critical assets (A/B/C tiering), and lock the asset register. Target: 95% asset data completeness.
PM schedule rebuild
Rebuild PM triggers for the five critical asset classes, attach OEM-spec checklists, and assign owners. Target: 100% of Tier-A assets on a PM schedule.
Condition monitoring live
Stand up monthly vibration, quarterly infrared, and continuous temperature logging. Target: 30% reduction in Tier-A emergency work orders vs. baseline.
Optimize & sustain
Tune PM frequencies using failure data, retire low-value tasks, and lock the reactive ratio below 25%. Target: $50K–$90K redirected from emergency to capital.
What changes when a district commits to reliability
The table below maps the operational shift that districts see when they move from a fire-to-fire reactive posture to a structured preventive maintenance program. The numbers are drawn from typical K–12 benchmarks.
| Operating metric | Reactive district (60%+) | Reliability-led (under 25%) |
|---|---|---|
| Reactive work order share | 60–70% of total WO hours | 15–25% of total WO hours |
| Average emergency repair premium | 3–5× planned cost | 1.2–1.6× planned cost |
| Mean time to repair (critical asset) | 18–36 hours | 4–8 hours (parts pre-staged) |
| Annual emergency spend (mid-size district) | $150K–$220K | $45K–$80K |
| Classroom hours lost to failures | 120–200 hrs/year | 25–50 hrs/year |
| Parent complaint volume (facility-related) | Baseline | −40% to −60% |
Stop paying the 3–5× emergency premium.
Configure your asset register, PM schedules, and condition-monitoring triggers in OxMaint — and watch the reactive ratio fall month over month.
Reducing emergency equipment failures in schools
How quickly can a district realistically cut emergency repairs?
Most districts see a 25–35% reduction in emergency work orders within the first six months once PM schedules are rebuilt for critical assets. Reaching the under-25% reactive ratio typically takes 12–18 months, because the program needs a full heating and cooling season to expose and fix failure patterns. You can Start Free Trial and begin importing your asset register the same day.
Which assets should we prioritize first?
Start with boilers, chillers, rooftop units, kitchen refrigeration, and elevators. Together these five asset classes drive roughly 80% of emergency calls and carry the highest disruption cost. Tier them as "A" critical, attach OEM-spec PM checklists, and add quarterly condition monitoring before expanding to lower-impact assets.
What is a healthy reactive maintenance ratio for a school district?
A reactive ratio below 25% is a strong, achievable target for K–12 districts within 18 months of a focused program. Best-in-class districts sustain 15–20%, aligned with APPA and ISO 55000 asset-management guidance. Anything above 50% indicates the maintenance team is firefighting rather than preventing.
Do we need extra staff to run a reliability program?
Not usually. Most districts reallocate 8–12 hours per technician per month from reactive calls into scheduled PM and condition checks — the same hours, redirected. The bigger need is a tool that schedules, tracks, and reports on the program so nothing falls through the cracks. Book a Demo to see the workflow.
How do we measure the savings from fewer emergency repairs?
Compare the average cost of emergency versus planned repairs for the same asset and failure mode — the 3–5× premium is your avoided cost per prevented failure. Multiply by the year-over-year reduction in emergency work orders, then subtract the cost of added PM labor and parts. Most districts recover $50K–$90K annually within the first full program year.
Build a district that fails less, learns faster, and spends smarter.
OxMaint gives your maintenance team the asset register, PM scheduling, condition-monitoring triggers, and reactive-ratio dashboard to cut emergency equipment failures — and keep them down.
Free 14-day trial · No credit card