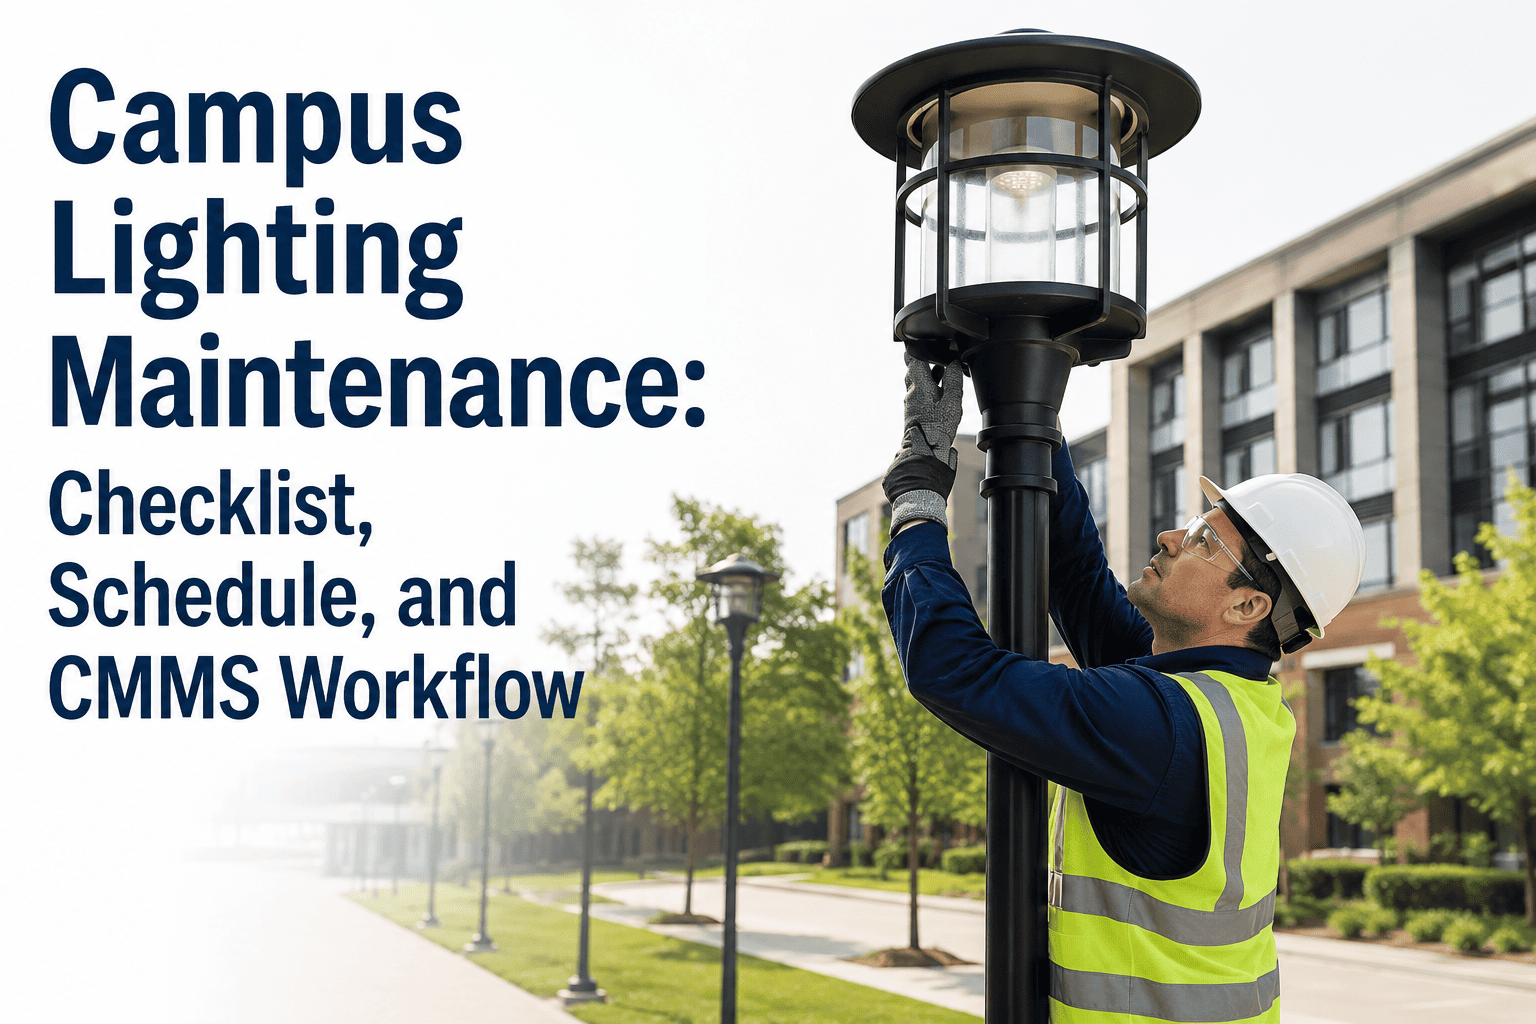
A single burned-out light over a parking lot or stairwell rarely gets reported the night it fails — students and staff just route around it, and it can stay dark for weeks before anyone logs a complaint. Independent research on public lighting has linked well-lit areas to violent crime reductions as high as 39%, and a recent citywide LED upgrade study recorded a 15% drop in outdoor night-time crime. At the same time, switching campus fixtures to LED typically cuts lighting electricity use by 30 to 50%, with some districts reporting savings above 80% once dimming controls are added. See how OxMaint tracks every campus fixture, outage, and relamp cycle before the next dark stairwell turns into a safety complaint.
A Campus Lighting Plan Needs to Track Two Numbers, Not One
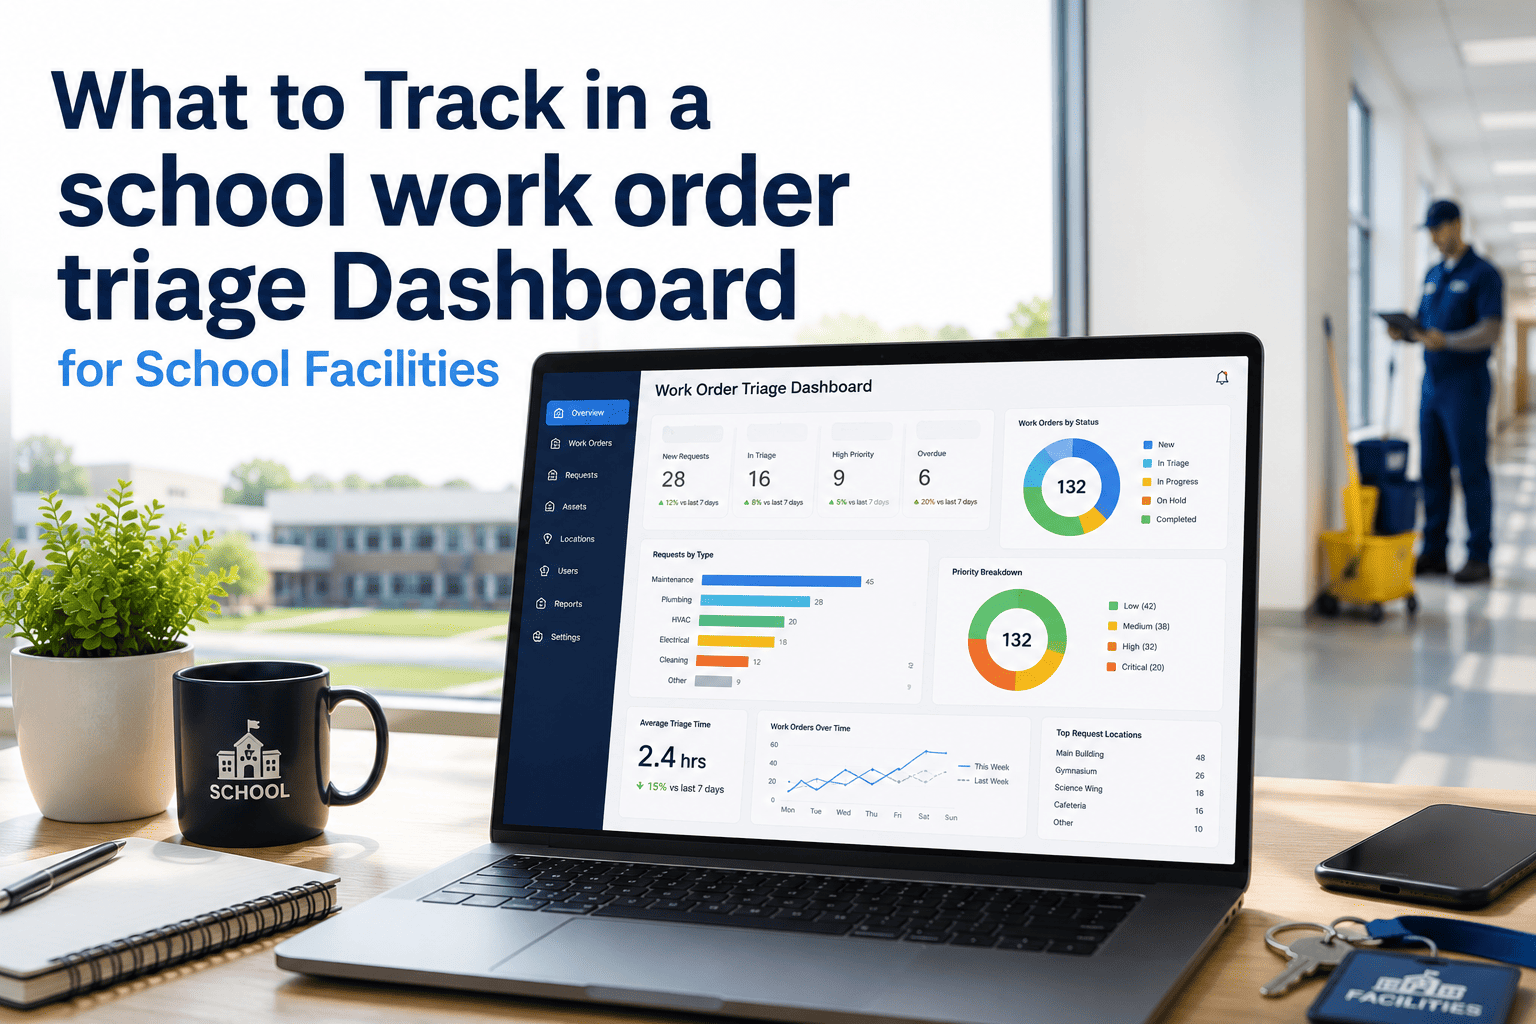
A district running on phone calls and paper outage logs usually finds out a lot has gone dark from an incident report, not a dashboard. OxMaint tracks fixture uptime, days-dark by zone, and the energy draw behind every building and lot, in real time.
A Burned-Out Light Is the Easiest Failure to Miss
Lighting failures do not trip an alarm or stop a class from running, so they sit until a person happens to notice. That gap matters more than it looks: the same research that ties dark areas to higher incident rates shows the safety benefit only holds while the lights actually stay on. A campus that tracks fixture uptime the same way it tracks HVAC uptime catches a dead pole light within days instead of after someone reports a near-miss in that same parking lot.
Four Views Every Facilities Team Checks Before Dark Falls
Get a Live View of Every Campus Light in Under an Hour
Connect your fixture inventory to OxMaint and see outage status, relamp cycles, and energy use by building from your first session.
What Each Days-Dark Range Means for Your Campus
| Days Dark | Zone | What It Signals | Typical Action |
|---|---|---|---|
| 0 to 2 days | On Track | Normal relamp turnaround time | No action needed |
| 3 to 7 days | Monitor | Approaching the safety response window | Confirm parts and crew availability |
| 8 to 21 days | At Risk | Likely already contributing to a dark zone | Escalate to the priority queue |
| 22 days or more | Safety Gap | Documented liability and incident exposure | Immediate dispatch and report |
A Lighting Plan Only Helps If It Closes the Loop
A spreadsheet can list outages just as well as software can. The difference is what happens after a light is logged as dark — whether it turns into a dispatched technician with the right bulb already in hand, or sits in an inbox until someone follows up.
Campus Lighting Maintenance, Explained
Stop Finding Out About Dark Zones From a Safety Report
See live fixture uptime, outage aging, and energy use by zone, and close the loop before a complaint forces the issue.