Every cement kiln is talking to the control room in real time, and most plants only listen to half the sentence. Kiln inlet O2 sitting at 1.5 to 2%, CO climbing past 0.1%, and exit gas temperature drifting 10°C above baseline are not three separate readings, they are one combustion story: how much air is getting in where it shouldn't, how completely the fuel is burning, and how much heat is walking out the top of the preheater instead of staying in the clinker. Plants that log these three numbers together, shift after shift, catch a burner going lean or a duct seal failing days before the fuel bill shows it. Plants that check them one at a time on separate screens usually find out from the specific energy report at month end, when the fuel is already burned. Book a demo to see how Oxmaint tracks kiln inlet O2, CO, and exit gas temperature as one connected trend instead of three unrelated readings.
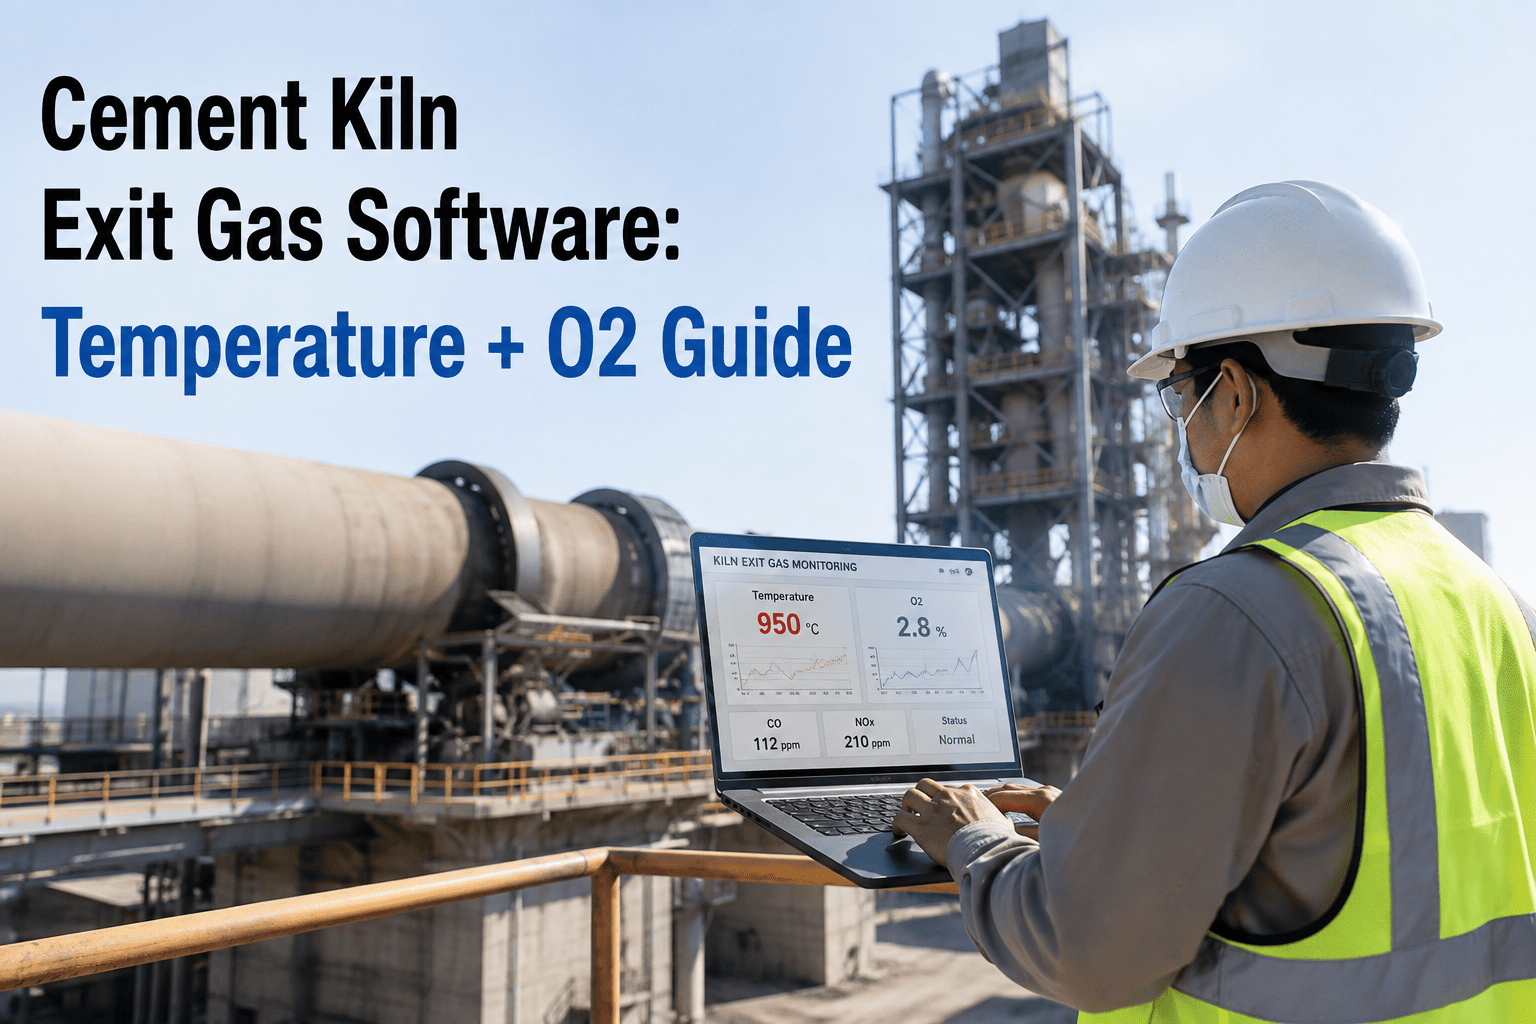
Cement kiln exit gas software is a CMMS-based tracking system that logs kiln inlet O2, CO, and preheater exit gas temperature together, correlates them against fuel rate and false air sources, and flags the combination that signals lean combustion, duct leakage, or coating-driven heat loss before it shows up as excess specific energy at month end. Because these three readings move together, tracking them as one trend catches the root cause faster than checking each gauge in isolation.
Three Numbers, One Combustion Story
Kiln inlet O2, CO, and exit gas temperature are usually displayed on three different screens, watched by three different people, and reported in three different formats. In reality they describe one physical event: how air, fuel, and heat move through the burning zone and up the tower. Reading them together turns three lagging indicators into one leading signal.
Normal range runs 1.5 to 2% at the kiln inlet. A rising trend without a fuel rate change usually points to false air entering through seals, expansion joints, or a leaking riser duct rather than a genuine combustion problem.
CO above 0.1% at the kiln inlet confirms incomplete combustion. Paired with a low O2 reading, it usually means the burner is running fuel-rich; paired with normal O2, it more often points to poor flame shape or fuel distribution.
Every 10°C above the proven baseline for a 5-stage tower costs roughly 1.5 to 2% in excess fuel. A sustained rise with stable O2 and CO usually traces back to cyclone buildup or a dip tube failure rather than the burner itself.
Stop Reading O2, CO, and Exit Temperature on Three Different Screens
Oxmaint correlates all three against fuel rate and false air sources so your team catches the cause, not just the symptom.
Why Exit Gas Discipline Breaks Down on the Floor
Operators glance at O2 and CO on the DCS screen every round but rarely write the values down against fuel rate and time. Without a logged record, a slow drift over three shifts looks identical to normal noise.
Most plants know their exit gas temperature is "running a bit hot" without knowing the actual proven baseline for their current raw mix and production rate, so a 10°C rise is dismissed as normal variation.
A plant may have a dozen potential false air entry points across seals, joints, and inspection doors. Without inspection history tied to O2 trend changes, maintenance cannot tell which seal actually needs attention first.
The kcal/kg penalty from excess O2, CO, or exit temperature is usually calculated in a monthly energy review, weeks after the condition that caused it has already been corrected or forgotten.
How Oxmaint Tracks Kiln Exit Gas
Oxmaint establishes the proven O2, CO, and exit gas temperature baseline for each production rate and raw mix combination, so "normal" is a number instead of a feeling.
O2, CO, and exit temperature are logged every shift alongside fuel rate and feed rate, whether pulled from a DCS tag or entered manually from the panel.
When two or more signals move together outside their baseline window, Oxmaint flags the likely cause pattern, such as rising O2 with stable CO pointing to false air rather than a burner issue.
A confirmed false air pattern routes an inspection work order to the ranked seal or joint most likely responsible, based on inspection and repair history. Book a demo to see drift detection configured for your tower.
Where Exit Gas Signals Come From
Turn Three Gauges Into One Root Cause
Get a proven baseline, combined drift alerts, and ranked false air inspection routing built from your own kiln's history.
Structured Exit Gas Tracking vs Gauge Watching
| Metric | CMMS-Tracked Exit Gas Program | Gauge Watching / No Log |
|---|---|---|
| Time to Detect O2/CO Drift | Under 4 hours via combined trend alert | Discovered at monthly energy review |
| False Air Source Identification | Ranked by inspection history and O2 correlation | Guesswork during next shutdown walk-down |
| Excess Fuel from Exit Temperature Drift | 0.5 to 1% above proven baseline | 3 to 6% above baseline, uncorrected for weeks |
| CO Incidents per Quarter | 2 to 4, corrected same shift | 10 to 16, several persisting multiple shifts |
| Energy Report Accuracy | Root cause attached to every deviation | Deviation noted with no attributable cause |
What the Platform Tracks
Kiln inlet O2, CO, and exit gas temperature displayed on one timeline against fuel rate, so a shift supervisor sees the full combustion picture at a glance.
A recorded normal range for O2, CO, and exit temperature at each production rate and raw mix, replacing gut-feel judgment with an actual number.
Automatic detection of the specific combination of signal movements that points to false air, burner imbalance, or cyclone buildup, sent to the right role.
Seals, joints, and inspection doors are ranked by prior repair frequency and correlation strength to O2 trend changes, so inspection time goes to the right spot first.
The kcal/kg cost of every exit gas deviation is calculated at the shift level instead of the monthly rollup, so the team sees the cost while it is still happening.
Confirmed exit temperature drift routes directly to riser duct and cyclone inspection schedules, connecting the gas signal to the physical component behind it.
Where Most Plants Stand Today
Outcomes After Oxmaint Deployment
Investment vs Return
| Component | Cost | Annual Savings | Payback |
|---|---|---|---|
| Baseline and Signal Setup | $8K one-time configuration | $155K from reduced exit temperature drift | Under 3 weeks |
| Combined Drift Alerting | $10K per year platform cost | $90K from faster CO and O2 correction | Under 4 weeks |
| False Air Source Ranking | $6K per year | $70K from targeted seal repairs | Under 6 weeks |
| Full Exit Gas Program | $24K per year | $315K+ combined avoidance | Under 4 weeks |
Frequently Asked Questions
Your Kiln Already Told You Where the Fuel Is Going. Start Logging the Answer.
Combined O2, CO, and exit gas temperature tracking, proven baselines, and ranked false air inspection routing, live in under three weeks.