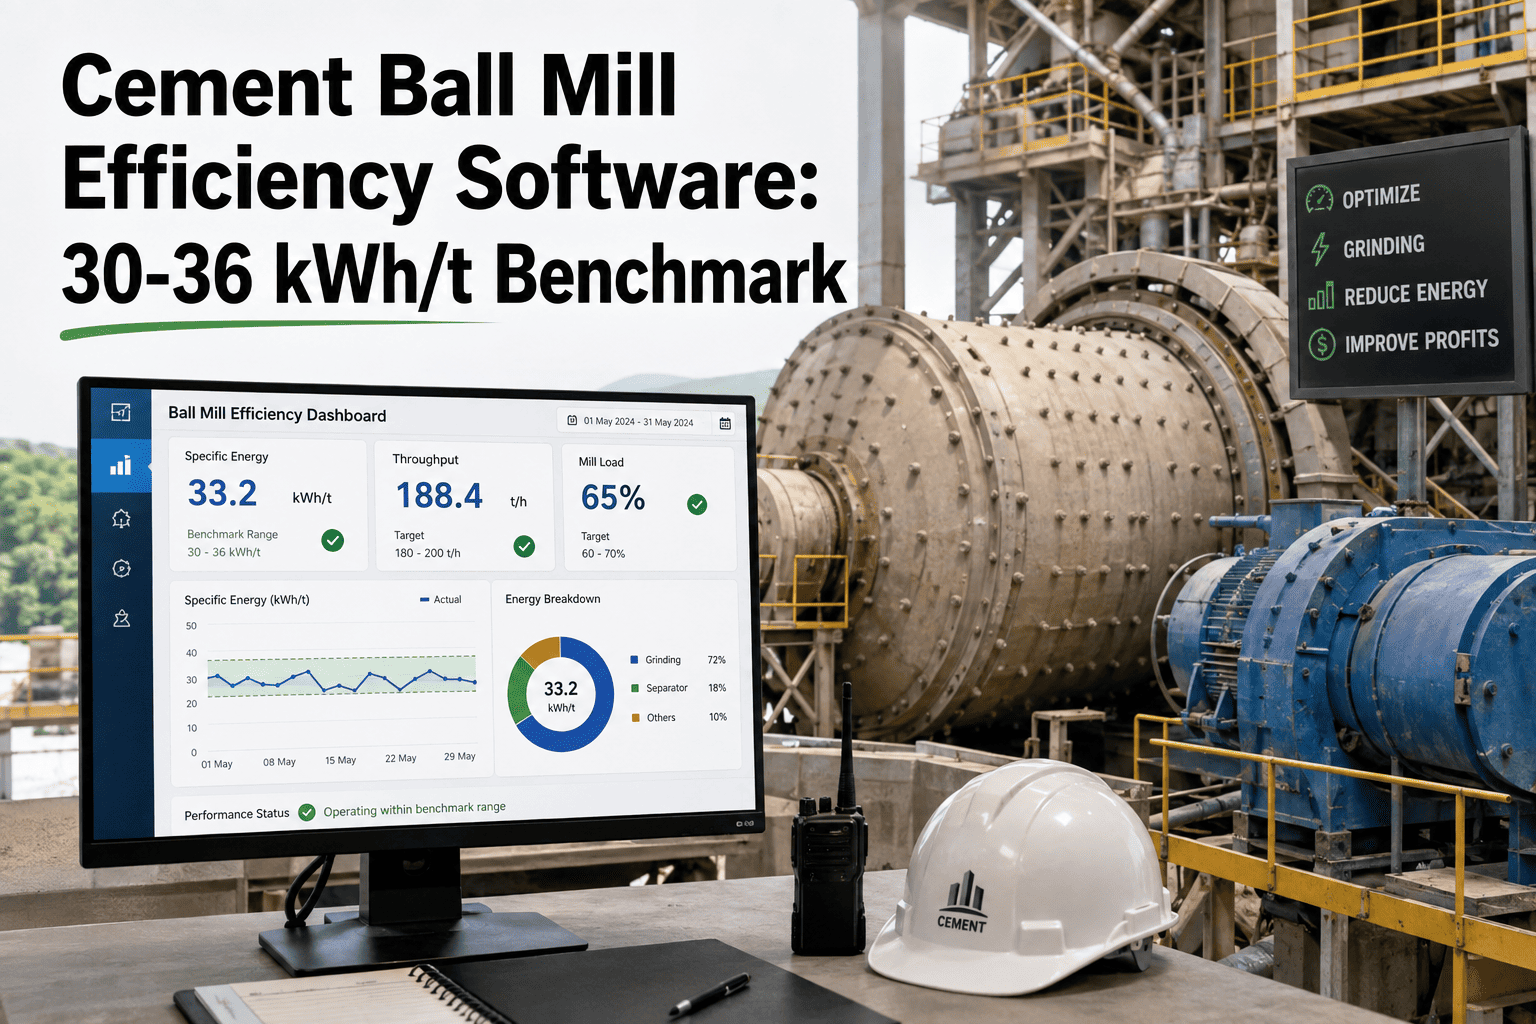
Most cement ball mills run 15 to 25 percent above the 30-36 kWh/t specific energy benchmark that a well-tuned closed circuit is capable of hitting, and the gap is rarely a design problem — it is drift. Worn liners change the lifting profile, the grinding media charge quietly loses top-size balls to wear, and classifier vanes drift out of calibration long before anyone notices the tonnage-per-kWh number sliding. Each of these levers moves on its own wear curve, which is why plants tracking kWh/t as one monthly average rarely find the actual root cause. Oxmaint logs liner readings, media top-ups, classifier settings, and mill power draw against tonnage inside one CMMS, so a rising SEC trend can be traced back to the lever that moved it. Start your Start Free Trial to start tracking your mill's real energy benchmark today.
BALL MILL SEC BENCHMARK
Is your ball mill really running at 30-36 kWh/t, or just close enough?
Specific energy consumption drifts one lever at a time — a worn liner here, a light media charge there. A CMMS that tracks each lever separately is the only way to catch drift before it becomes a permanent cost.
18-25%
Typical SEC gap above benchmark in mills where liner, media, and classifier data are not tracked together
BENCHMARK BY CONFIGURATION
What 30-36 kWh/t actually looks like across mill types
The benchmark shifts with circuit design, so comparing your mill against the right configuration matters more than chasing a single industry-wide number.
| Mill configuration |
Typical industry SEC |
Achievable SEC, well-tuned |
| Open circuit ball mill |
42-48 kWh/t |
38-42 kWh/t |
| Closed circuit with classifier |
36-42 kWh/t |
30-36 kWh/t |
| Closed circuit with roller press pre-grind |
28-34 kWh/t |
24-28 kWh/t |
| Vertical roller mill, reference |
22-28 kWh/t |
20-24 kWh/t |
WORKED EXAMPLE
How a two-month lever audit closed a 6 kWh/t gap
CASE PATTERN
A closed-circuit mill rated for 32 kWh/t was consistently running near 38 kWh/t, with the deviation blamed on raw mix hardness. Logging liner thickness, media top-up records, and classifier vane position separately showed the real driver: a 14 percent shortfall in the top-size ball charge that had gone untracked for four months. A single media top-up and a classifier recalibration brought SEC back to 33 kWh/t within two weeks.
EFFICIENCY LEVERS
Six levers that move ball mill kWh/t, tracked separately
Each lever below drifts on its own schedule. Tracking them as one blended average is exactly why most plants miss the actual cause of rising energy cost per tonne.
01
Liner wear profile
Worn lifter bars flatten the lifting angle, reducing cascade energy and forcing longer grind times for the same fineness.
02
Grinding media charge and gradation
A shrinking top-size ball population loses impact energy on coarse feed, even while the total charge weight looks unchanged.
03
Classifier vane calibration
Drifted vane angles send fines back to the mill for re-grinding, wasting energy on material that already met spec.
04
Mill filling degree
Overfilling cushions the impact zone, while underfilling wastes liner life — both push kWh/t away from benchmark.
05
Feed size consistency
Wide swings in clinker feed size force the mill to compensate constantly, preventing a stable power draw baseline.
06
Ventilation and material flow
Poor mill ventilation lets fines re-agglomerate, extending residence time and quietly raising the kWh needed per tonne.
READY TO CLOSE THE GAP
Find out which lever is costing your mill the most kWh/t.
Deploy Oxmaint's lever-tracking workflow and get your first SEC breakdown within a week.
OPTIMIZATION ROADMAP
An eight-week roadmap from drift to a verified benchmark
Weeks 1-2
Baseline SEC capture
Log mill power draw, tonnage, liner thickness, media charge, and classifier settings daily to build a true current-state baseline.
Weeks 3-4
Lever-by-lever isolation
Compare each lever's trend against the SEC curve to identify which one correlates most closely with the current gap.
Weeks 5-6
Trigger-based work orders
Configure thresholds so a liner wear limit or media shortfall auto-generates a work order instead of waiting for the next scheduled stop.
Weeks 7-8
Verification and re-benchmark
Re-measure SEC against the original baseline and lock in the new lever thresholds as the mill's ongoing operating standard.
KEY CAPABILITIES
What a ball mill efficiency CMMS tracks for your reliability team
Liner wear tracking
Thickness readings logged per segment, with wear-rate trends flagged before the lifting profile degrades performance.
Media charge logging
Top-up events and gradation checks recorded per mill, so a shrinking top-size charge shows up before SEC drifts.
Classifier calibration history
Vane settings and adjustment dates stored against the asset record, closing the loop between recalibration and SEC recovery.
SEC trend analytics per lever
Power draw and tonnage are broken down against each lever's own timeline, not blended into one monthly average.
Cross-mill benchmarking
Compare SEC and lever data across multiple mills or lines to find which configuration is actually closest to benchmark.
Automated re-grind alerts
A rising fines recirculation rate triggers an alert before it silently adds hours of re-grind time to every batch.
FREQUENTLY ASKED
Cement ball mill efficiency CMMS — your questions answered
What SEC should our closed-circuit ball mill be targeting?
Most closed-circuit mills with a classifier can reach 30-36 kWh/t when liners, media, and classifier settings are all within spec.
Start Free Trial to see where your mill sits against that range.
How do we know which lever is causing our SEC drift?
Compare each lever's own trend line against the SEC curve rather than a single blended average. The lever whose trend line bends first is usually the driver.
Do we need new instrumentation to track these levers?
No. Most plants already log mill power draw and tonnage in the DCS. Liner thickness, media top-ups, and classifier settings can be logged manually inside the CMMS.
How long does it take to see a measurable SEC improvement?
Plants that complete the eight-week lever audit typically recover 3 to 6 kWh/t within the first two months once the driving lever is corrected.
Can we benchmark multiple mills against each other?
Yes. Each mill is tracked as its own asset with its own lever history, so plants can compare SEC and lever data across lines.
Book a Demo to see a multi-mill comparison view.
START TRACKING TODAY
Your mill's energy cost should be explained by data, not raw mix excuses.
Join cement plants using Oxmaint to trace SEC drift back to the exact lever that caused it.
Free 14-day trial · No credit card